Ian Patrick, FISM News
[elfsight_social_share_buttons id=”1″]
Demographics in polling and surveys help us to understand our nation and culture a little bit more. However, it appears that most Americans aren’t aware of the scope of certain demographics.
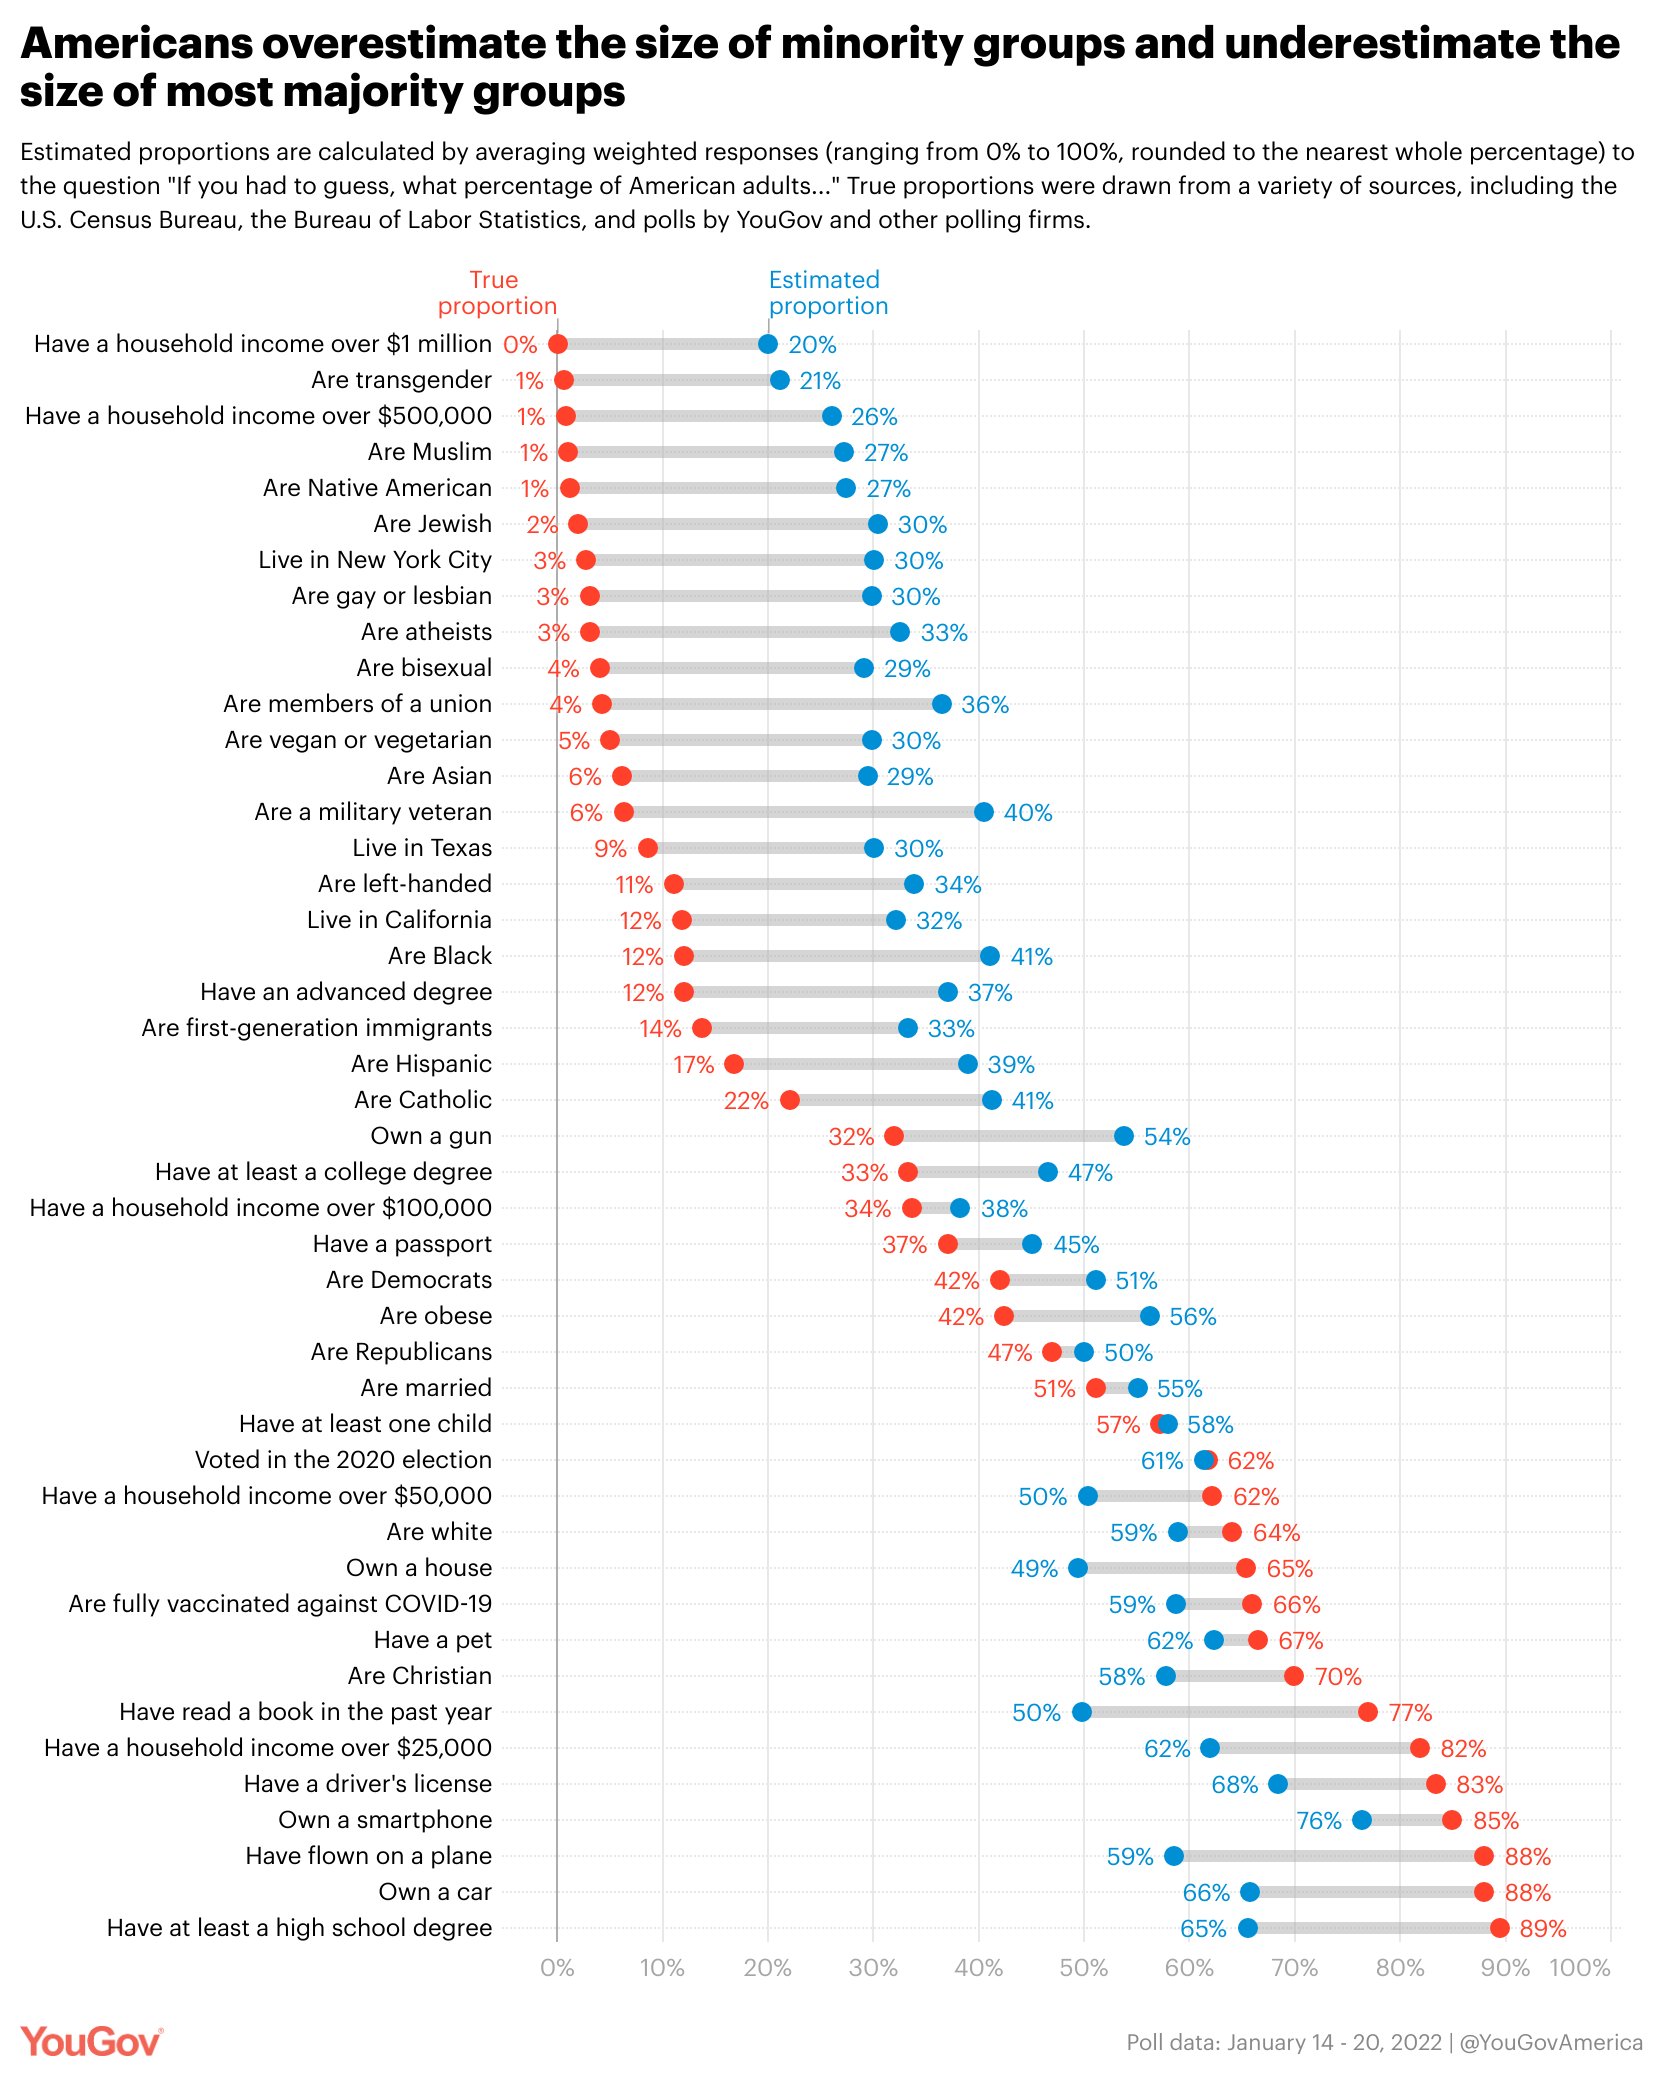
A recent YouGovAmerica poll asked Americans about the average representative percentages for demographics including household income, race, religion, political affiliation and others. What the data showed, according to Senior Survey Data Journalist Taylor Orth, was that “Americans tend to vastly overestimate the size of minority groups.”
For instance, the poll asked about the estimated population percentage of American adults who are transgender. The data, representing the average, showed that those who were polled believe 21% of American adults are transgender. The true proportion lies at 1%, a 20 percentage point difference.
Another example asks how many American adults are atheists, which the data showed to be a 33% estimate. In reality, only 3% of American adults say they are atheist making for a whopping 30 percentage point difference.
The other differences can be viewed in the chart below:
The population estimations in the chart also point to another fact: that Americans tend to underestimate majority groups in the nation. For instance, those who were polled believe only 65% of Americans have at least a high school degree, while the true number is 89%.
Orth also points out, “The most accurate estimates involved groups whose real proportion fell right around 50%, including the percentage of American adults who are married (estimate: 55%, true: 51%) and have at least one child (estimate: 58%, true: 57%).”
This trend of overestimating smaller populations and underestimating bigger ones is apparently nothing new. A 2016 Ipsos Perils of Perception survey highlighted similar issues across 40 countries concluding that “multiple reasons for these errors” exist according to Bobby Duffy, Managing Director of Ipsos Social Research Institute, London.
There are multiple reasons for these errors – from our struggle with simple maths and proportions, to media coverage of issues, to social psychology explanations of our mental shortcuts or biases. It is also clear from our “Index of Ignorance” that the countries who tend to do worst have relatively low internet penetrations: given this is an online survey, this will reflect the fact that this more middle-class and connected population think the rest of their countries are more like them than they really are.
Other studies and reports suggest that media portrayal may play into the population bias. In the past, multiple outlets such as Slate and Vox reported on surveys and polls of Americans overestimating the amount of immigrants, both legal and illegal. Often these outlets would come to the conclusion that most Americans are afraid of immigrants and this could be attributed to “the rise of Donald Trump” and “the recent surge of far-right parties,” to quote Zack Beauchamp of Vox.
However, Orth suggests a reasoning process called uncertainty-based rescaling as the ultimate decider of population misestimates.
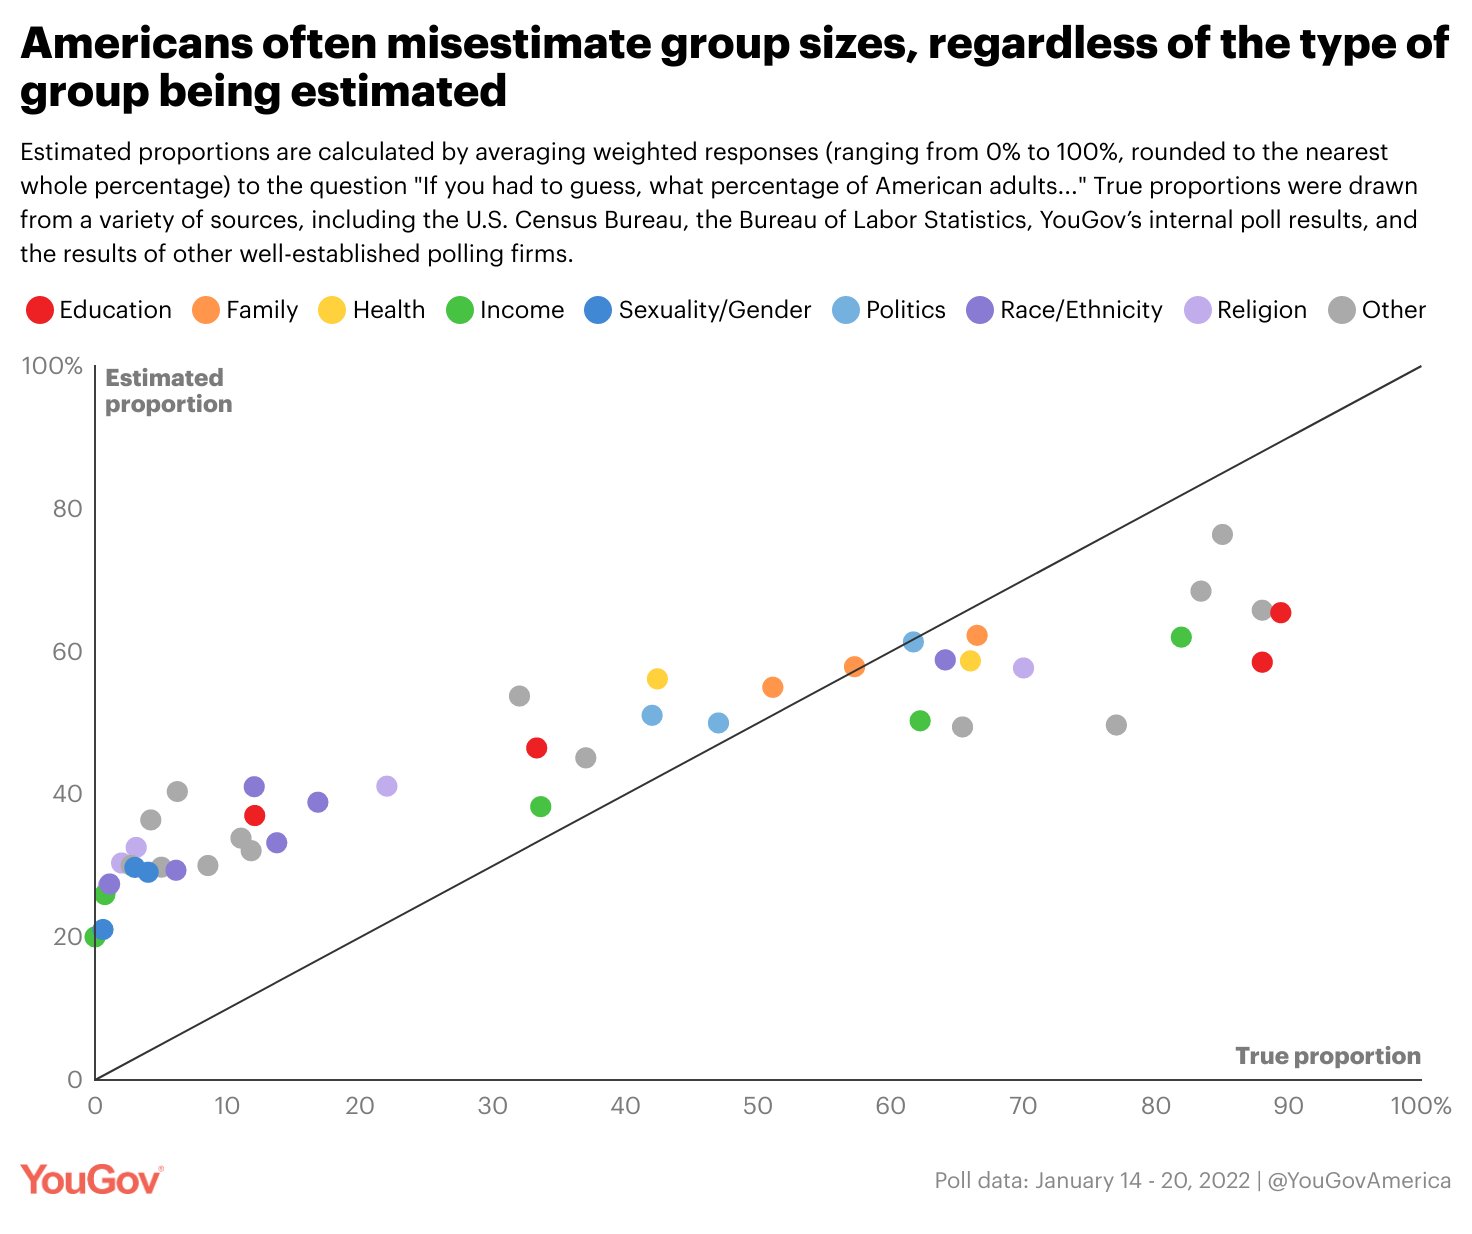
Uncertainty-based rescaling essentially means that when people are asked to make an estimation on something that they believe is not representative in their personal experience, they will try to rationalize their guess by over- and under-estimating the true number. Orth explains further:
When a person’s lived experience suggests an extreme value — such as a small proportion of people who are Jewish or a large proportion of people who are Christian — they often assume, reasonably, that their experiences are biased. In response, they adjust their prior estimate of a group’s size accordingly by shifting it closer to what they perceive to be the mean group size (that is, 50%). This can facilitate misestimation in surveys, such as ours, which don’t require people to make tradeoffs by constraining the sum of group proportions within a certain category to 100%.
Orth says this process also explains why the estimates for the population extremes (close to 0% or 100%) are “less accurate than estimates of populations that are closer to 50%.”


